In June of 1969, the Cuyahoga River in Cleveland, Ohio, caught fire. Filled for decades with raw sewage and various pollutants, Time Magazine once described the Cuyahoga as the river that “oozes rather than flows,” and in which a person “does not drown but decays.”
Congress and the Nixon administration acted quickly, and passed the Clean Water Act in October of 1972. The act was notable for prohibiting releases of high amounts of pollution in waterways, and for giving citizens a special role in caring for the nation’s water resources.
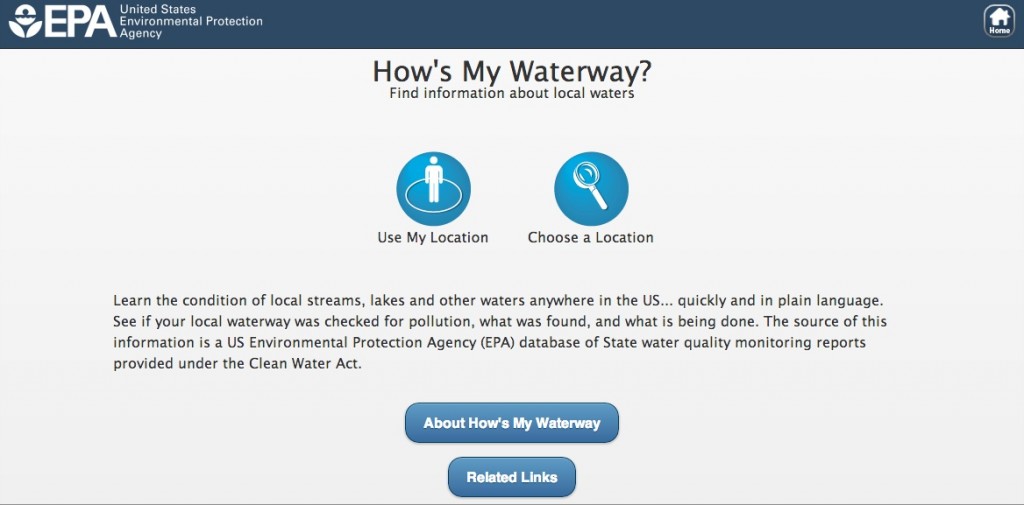
2012 marked the fortieth anniversary of the Clean Water Act. In honor of this occasion, the EPA developed How’s My Waterway, an interactive web tool that allows users to access data on the streams in their area directly from their smart phones, tablets, or desktop computers.
The app is an acknowledgement of the long-term need for localized stream data, rather than intimidating national statistics. According to Doug Norton, an environmental scientist with the EPA’s Office of Wetlands, Oceans and Watersheds, “The EPA’s [water quality] information, and the state information that it’s based on, has been out there for quite a while, in various forms.” Only until recently has there been a push to make this information easily accessible and understandable.
Norton recently gave an online demonstration of the web tool during an EPA Watershed Academy Webcast, and showed how the app can be used to display pollutant categories, pollutant sources, potential health risks, and plans for clean-up.
Unfortunately, there is currently little data available for the Letcher County area. A report for the North Fork of the Kentucky River shows that it is impaired by excess sediment and bacteria, and that it is not safe for recreation. This information has not been updated since 2010, however.
When asked why this information is two years old, Norton responded that, under the Clean Water Act, states have an obligation to report their water quality data bi-annually. This means that information for 2012 will be available very soon.
The only other streams in the Letcher County area that were assessed by the state were the left and right forks of Millstone Creek, which showed high acidity, and Bad Branch Creek, which tested as “unpolluted.”
The EPA’s decision to release this web-tool comes at a time of high interest in social media platforms that translate scientific information into easy-to-understand data. Similar web-tools, such as apps that display standards for swimming safety on Lake Ontario, focus on specific, regional issues. Others, such as one entitled The Riverview Project, allows recreationists to take pictures of their favorite streams, and then use their smart phones to upload them to a larger database that is similar to the currently popular web-app, Instagram.
Environmental educators are also using this new technology to encourage youth recreation. As part of their Environmental Education Week for 2013, The National Environmental Education Foundation has released a list of the top 10 apps for taking technology outdoors:
With the rise of new technologies, obtainable and understandable information on water quality will be something that benefits both rural and urban areas. However, because some of this data is outdated and scarce, it reveals a need for local water monitoring in areas that states have not tested.


Some UCWW sample data for 2011 and prior years are available in the Kentucky Department of Water (KDOW) database. Contact JoAnn Palmer at KDOW (JoAnn.Palmer@ky.gov)